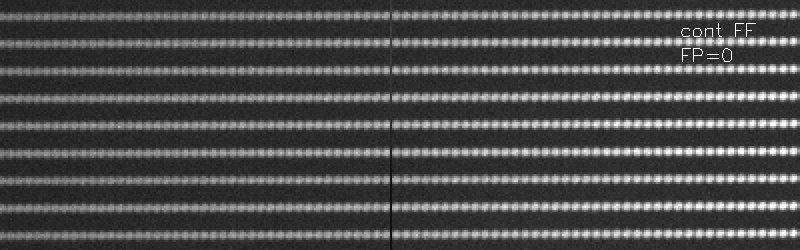
Fig. 14 : PYTHEAS scan with PMAS
Scan yourself through a series of continuum flatfield
PYTHEAS exposures with etalon spacing
increments of 20nm in the wavelength region near 500nm.
The picture shows a small fraction of the CCD frame with 9 PMAS spectra
in the wavelength region near 500nm. The dark line in the middle serves
as a reference. Observe how the Fabry Perot orders which are aligned
like pearls on a string move from left to right as the etalon spacing
is incremented. Use your browser FORWARD and BACKWARD buttons to step
back and forth to better see the effect. Compare later with a similar
scan of science exposures targeting the planetary nebula NGC6543.
. . .
NEXT FRAME
Last update September 12, 2004 by M.
Roth